Omen: Network Testbed Pipeline
Omen: Network Testbed Pipeline
The research behind Omen asked a simple question: can we make network-topology experiments both repeatable and easy to explore, without building a full custom simulator from scratch? Omen was designed as an experimental pipeline to automate topology tests and turn results into something researchers can actually use, with a focus on proving feasibility and exposing the limitations of a practical toolchain (Mininet-WiFi, Grafana, Docker, and lightweight driver code).
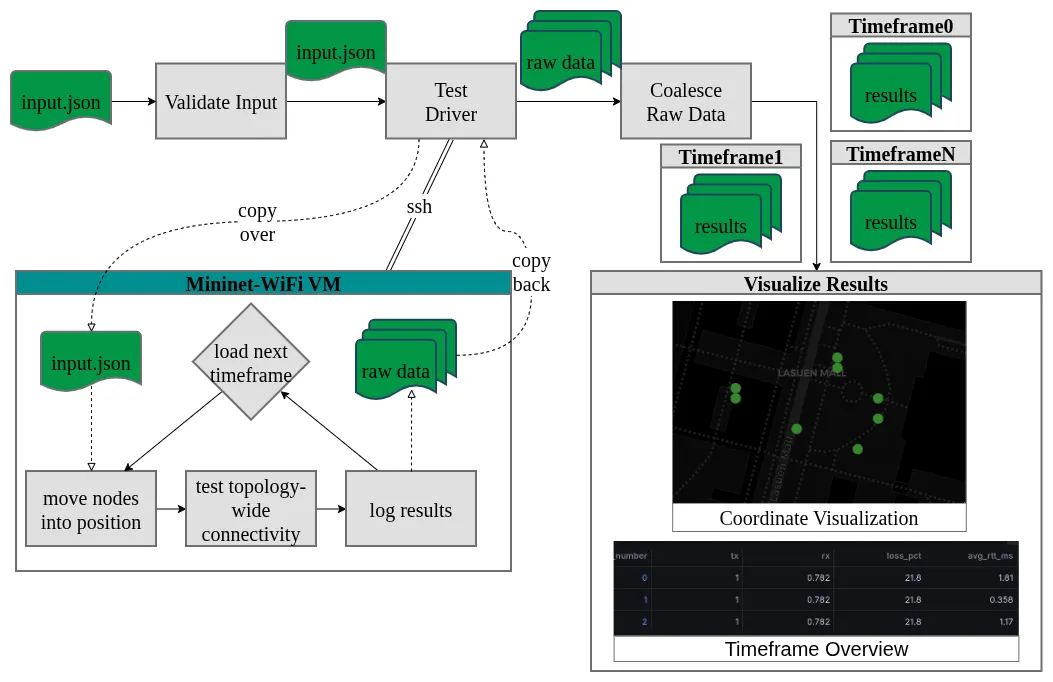
To study that, the project treated “an experiment” as a single, portable spec: one JSON file that defines the modeling assumptions, the topology layout, and how nodes move over time. Modeling is represented as a selectable energy-loss equation (used to approximate environmental effects like weather), while motion is expressed in timeframes so movement can occur and then be followed by a topology-wide connectivity test.
The core research contribution is the pipeline structure itself: validate the experiment spec, run the scenario on a backend, then standardize outputs for analysis. Omen includes a custom validation step to catch invalid or suspicious parameter choices, and a test driver that connects to a Mininet instance over SSH to generate nodes, apply per-timeframe movements, and re-run connectivity tests to observe how changing conditions affect latency and loss.
A big part of the research was translating “messy simulator output” into comparable evidence. Omen cleans raw stdout into organized CSVs (by timeframe and data type), loads them into SQLite, and presents the results in Grafana dashboards that support both high-level trend views and drill-down views for each phase of a run.
The outcome is a prototype research platform aimed at helping 99P quickly answer why a topology degrades and when it starts breaking: is it a movement event, persistent environmental loss, or scaling limits as node counts increase? The dashboards are meant to support rapid “what if” iteration, like adding access points or changing frequency to test mitigations under comparable scenarios.
Stay Connected
Follow our journey on Medium and LinkedIn.